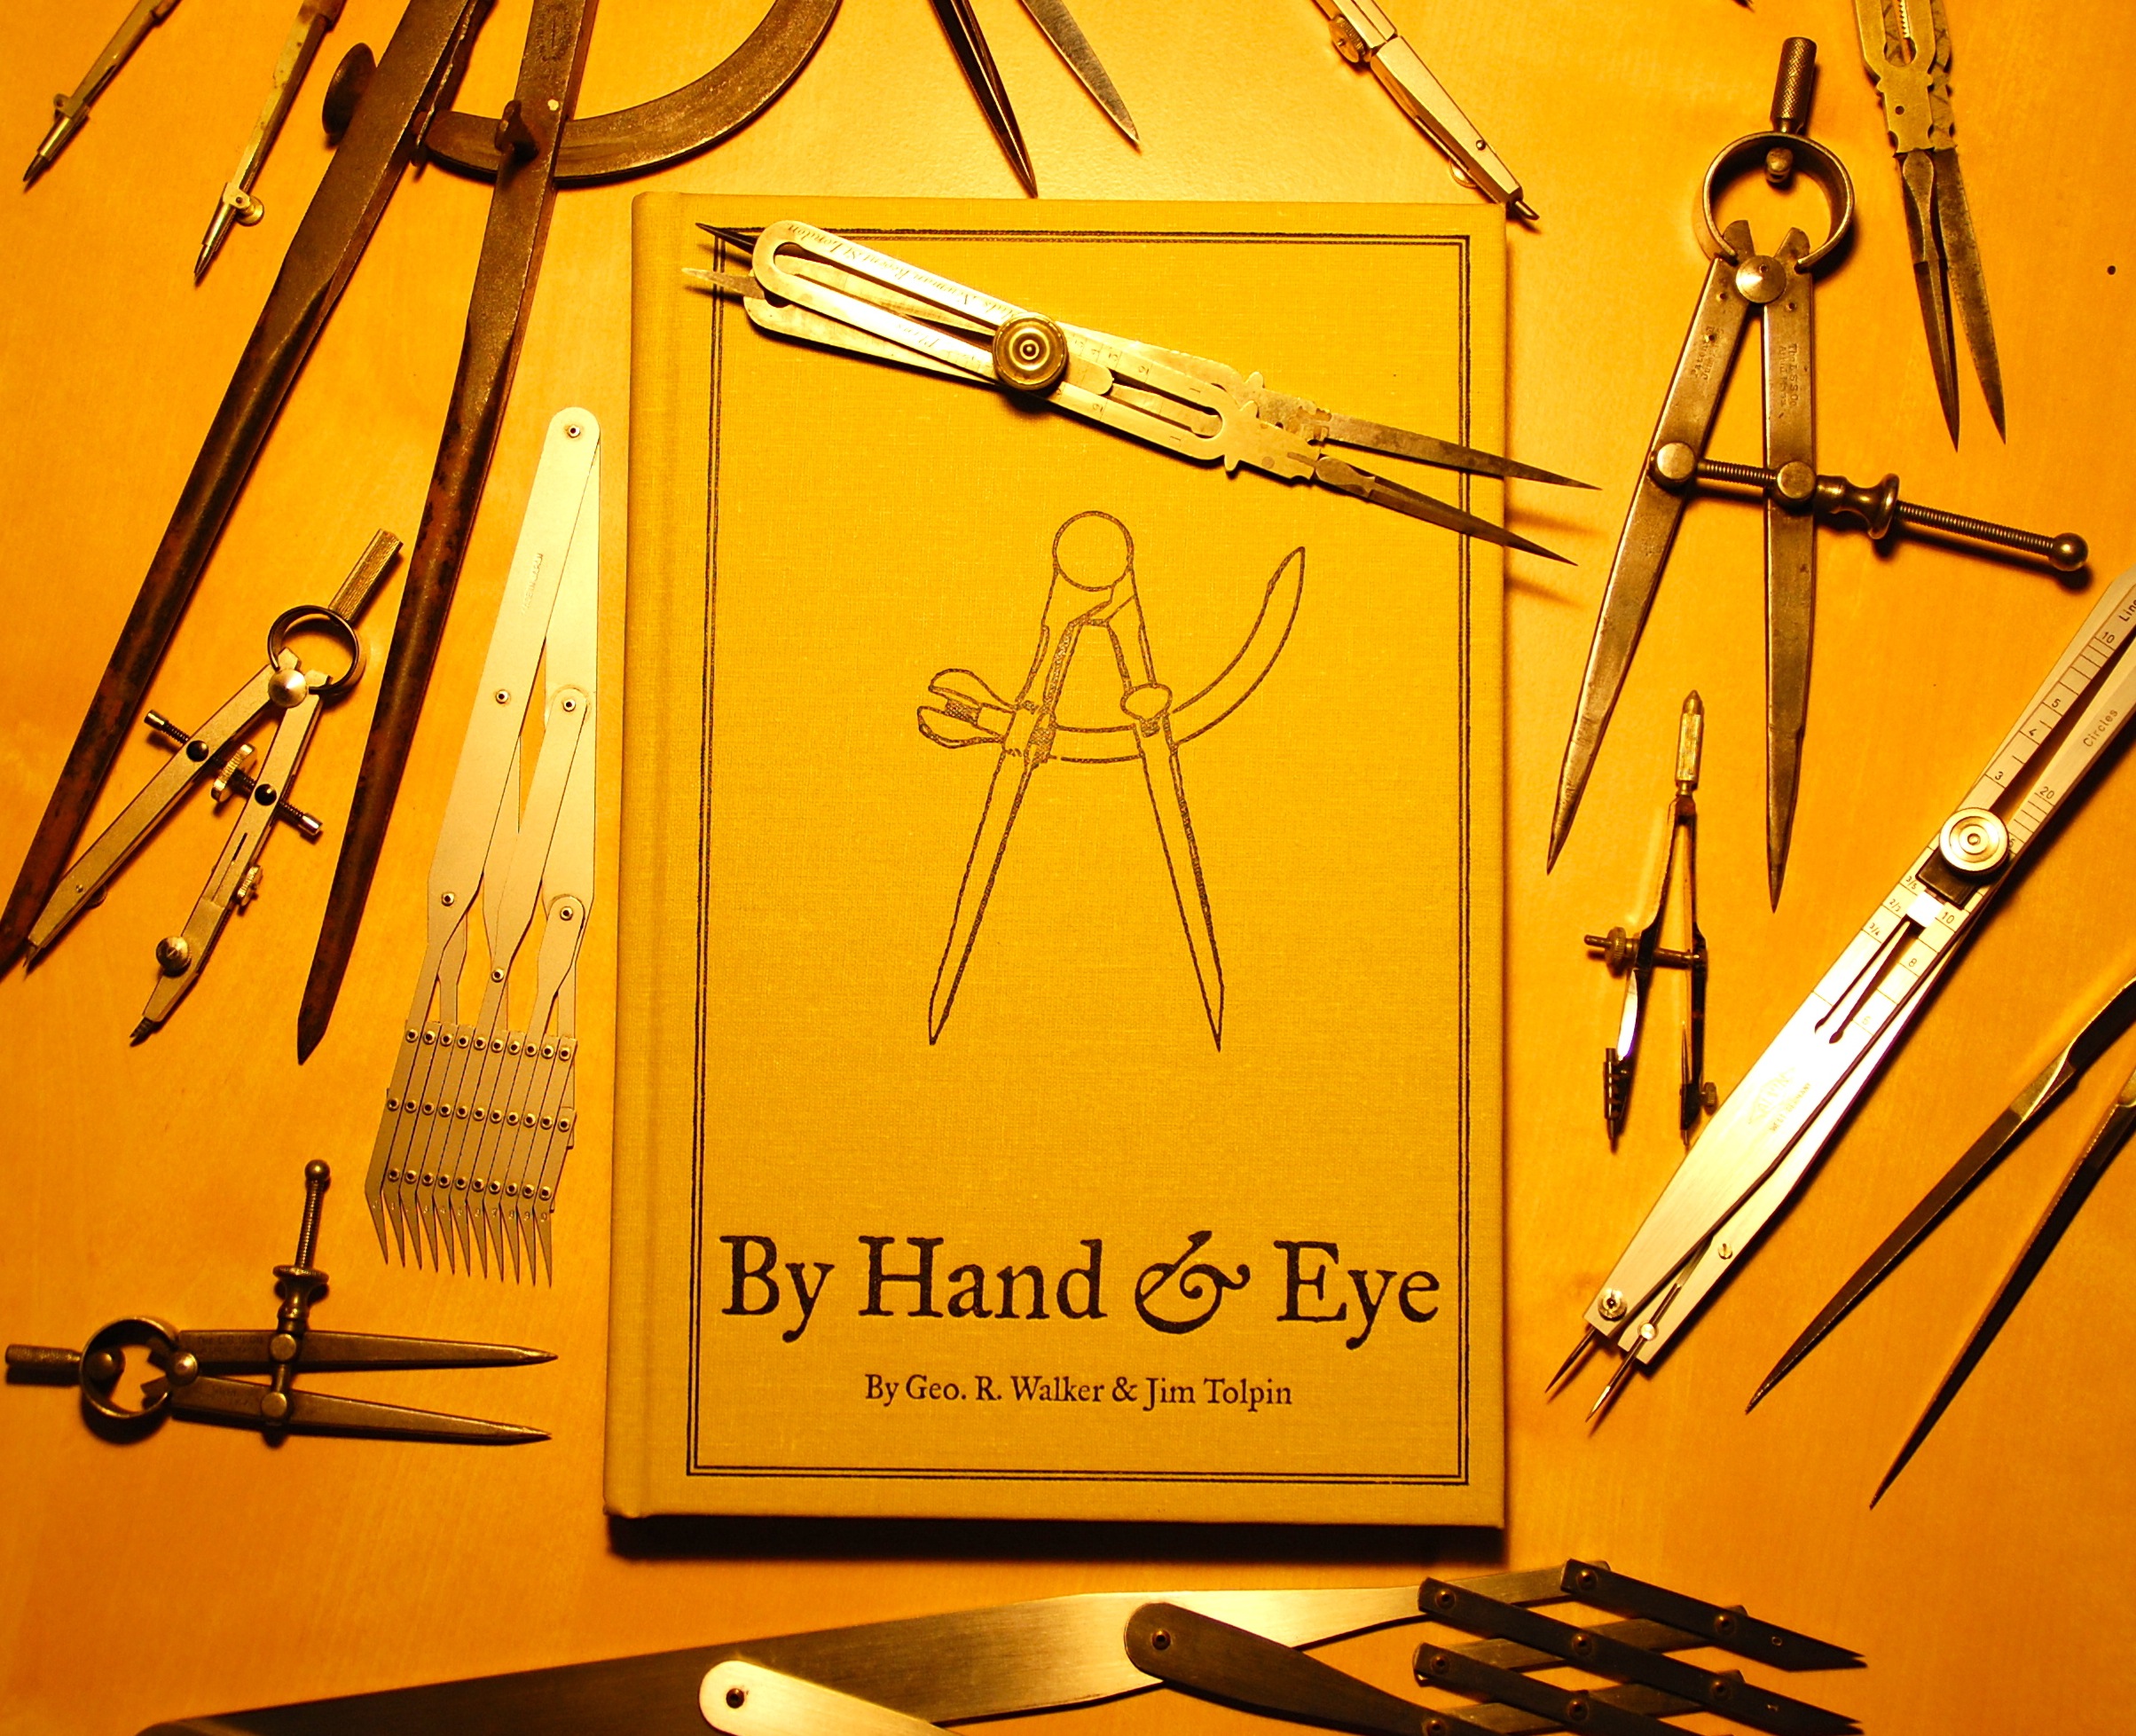
There are a lot of design books published every year and occasionally a few get written that are actually worth buying. By Hand & Eye is one of those. It’s a book that delivers where a lot of others have gone and failed. Written in an easy, nonsense-free style, the book sets out to explain the “art” of designing with proportions rather than numbers. I’ve found that a lot of books on design tend to read more like a doctoral thesis than something that will actually explain the material in easily understandable language. By Hand & Eye succeeds because authors Walker and Tolpin are actually practitioners of their craft rather than just writers. It’s like taking a film course from someone who’s actually made a film rather than just talk about it.
Lost Art Press is a relatively new publisher who’s books are primarily aimed at the traditional woodworking crowd but you’ll be missing out on some gems if you assume their books are only useful to furniture makers. Their books are quality products both in their content and their construction. These are not the cheap perfect-bound high-acid tomes that are the product of most publishers and will end up disintegrating on you shelves. (With that in mind, If you do happen to be a furniture and book lover, and the name Andre Roubo means anything to you, you need to must check this page out immediately.)
Jim Tolpin was the most familiar to me as I own a number of his other books, but George Walker is relatively new to the publishing world. George writes a blog called Design Matters which is a record of his journey in the search for understanding what makes for good design. He and Tolpin met several years ago and found they were both on the same path but had approached it from different directions; Walker from a preference for traditional furniture and Tolpin from a more modern bent. Both were determined to discover the “magic formula” that meant the difference between a chair or building being handsome or ugly.
What they discovered is that numbers don’t matter. In fact much of the time they just get in the way. Most of the treasured icons of furniture and architecture were made before the measured rule was in use. It was the divider that ruled rather than the inch or foot. And this system of working when far beyond architecture and furniture.
The exercises they outline are especially helpful if you have only worked on a computer as you’ll be forced to think purely about the design process without the intrusion of a ‘digital helper’. By learning to think proportionally you’ll approach design from a much less restricted footing. A lot of times computers just get in the way of good design instead of enhancing it. Once you stop using numbers and just concentrating on ratios you’ll realize you can make things much easier for yourself.
The book are also a great introduction to traditional geometry and proportion if you haven’t really studied it before or a great refresher if it’s been a while since you exchanged a mouse for a compass. They are developing a website for online access to exercises in the book and you can download some sample animations of the exercises from this web page. You can also read more about the book and download a sample chapter on this page.
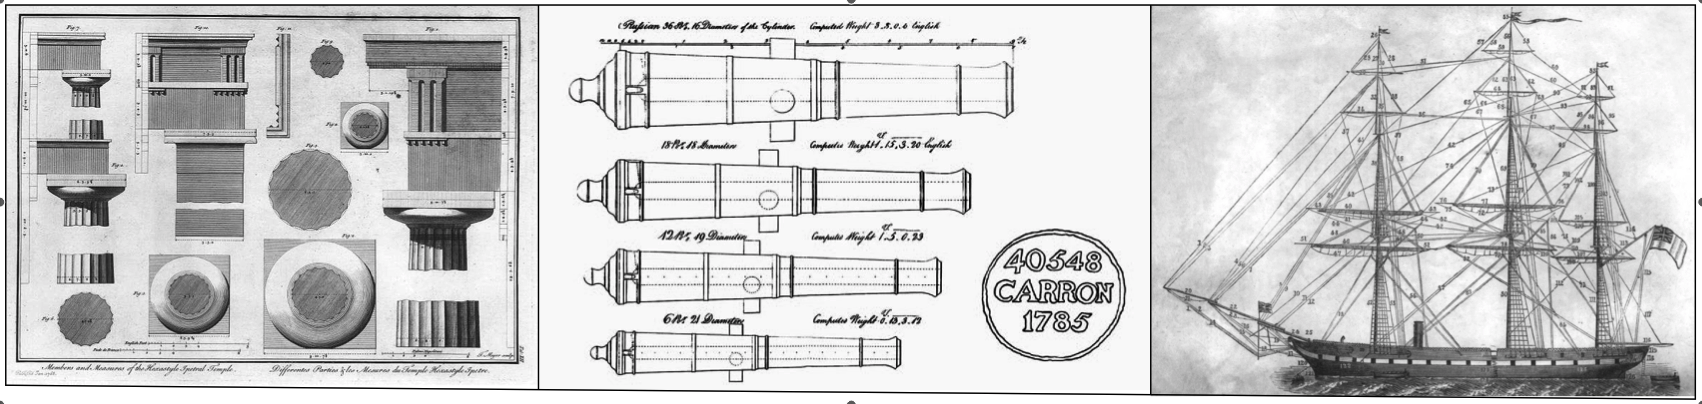
While the book does concentrate on furniture design the information translates to everything else in the design world as most of the principals are found in classic architecture.

For example, traditional sailing ships and cannon have a lot in common with the classical orders in that they were all based on a proportional system. This not only insured that all the moulds would be in proportion to the length of a cannon barrel but that the trunions would be sturdy enough to carry the barrels weight and that the wall thickness of the tube would handle the explosions of the powder charges. The ship’s rigging was based on a similar system. If you knew the mast length you could figure the thickness of the mast stays and the diameter of every piece of rigging on the ship, all without a calculator.
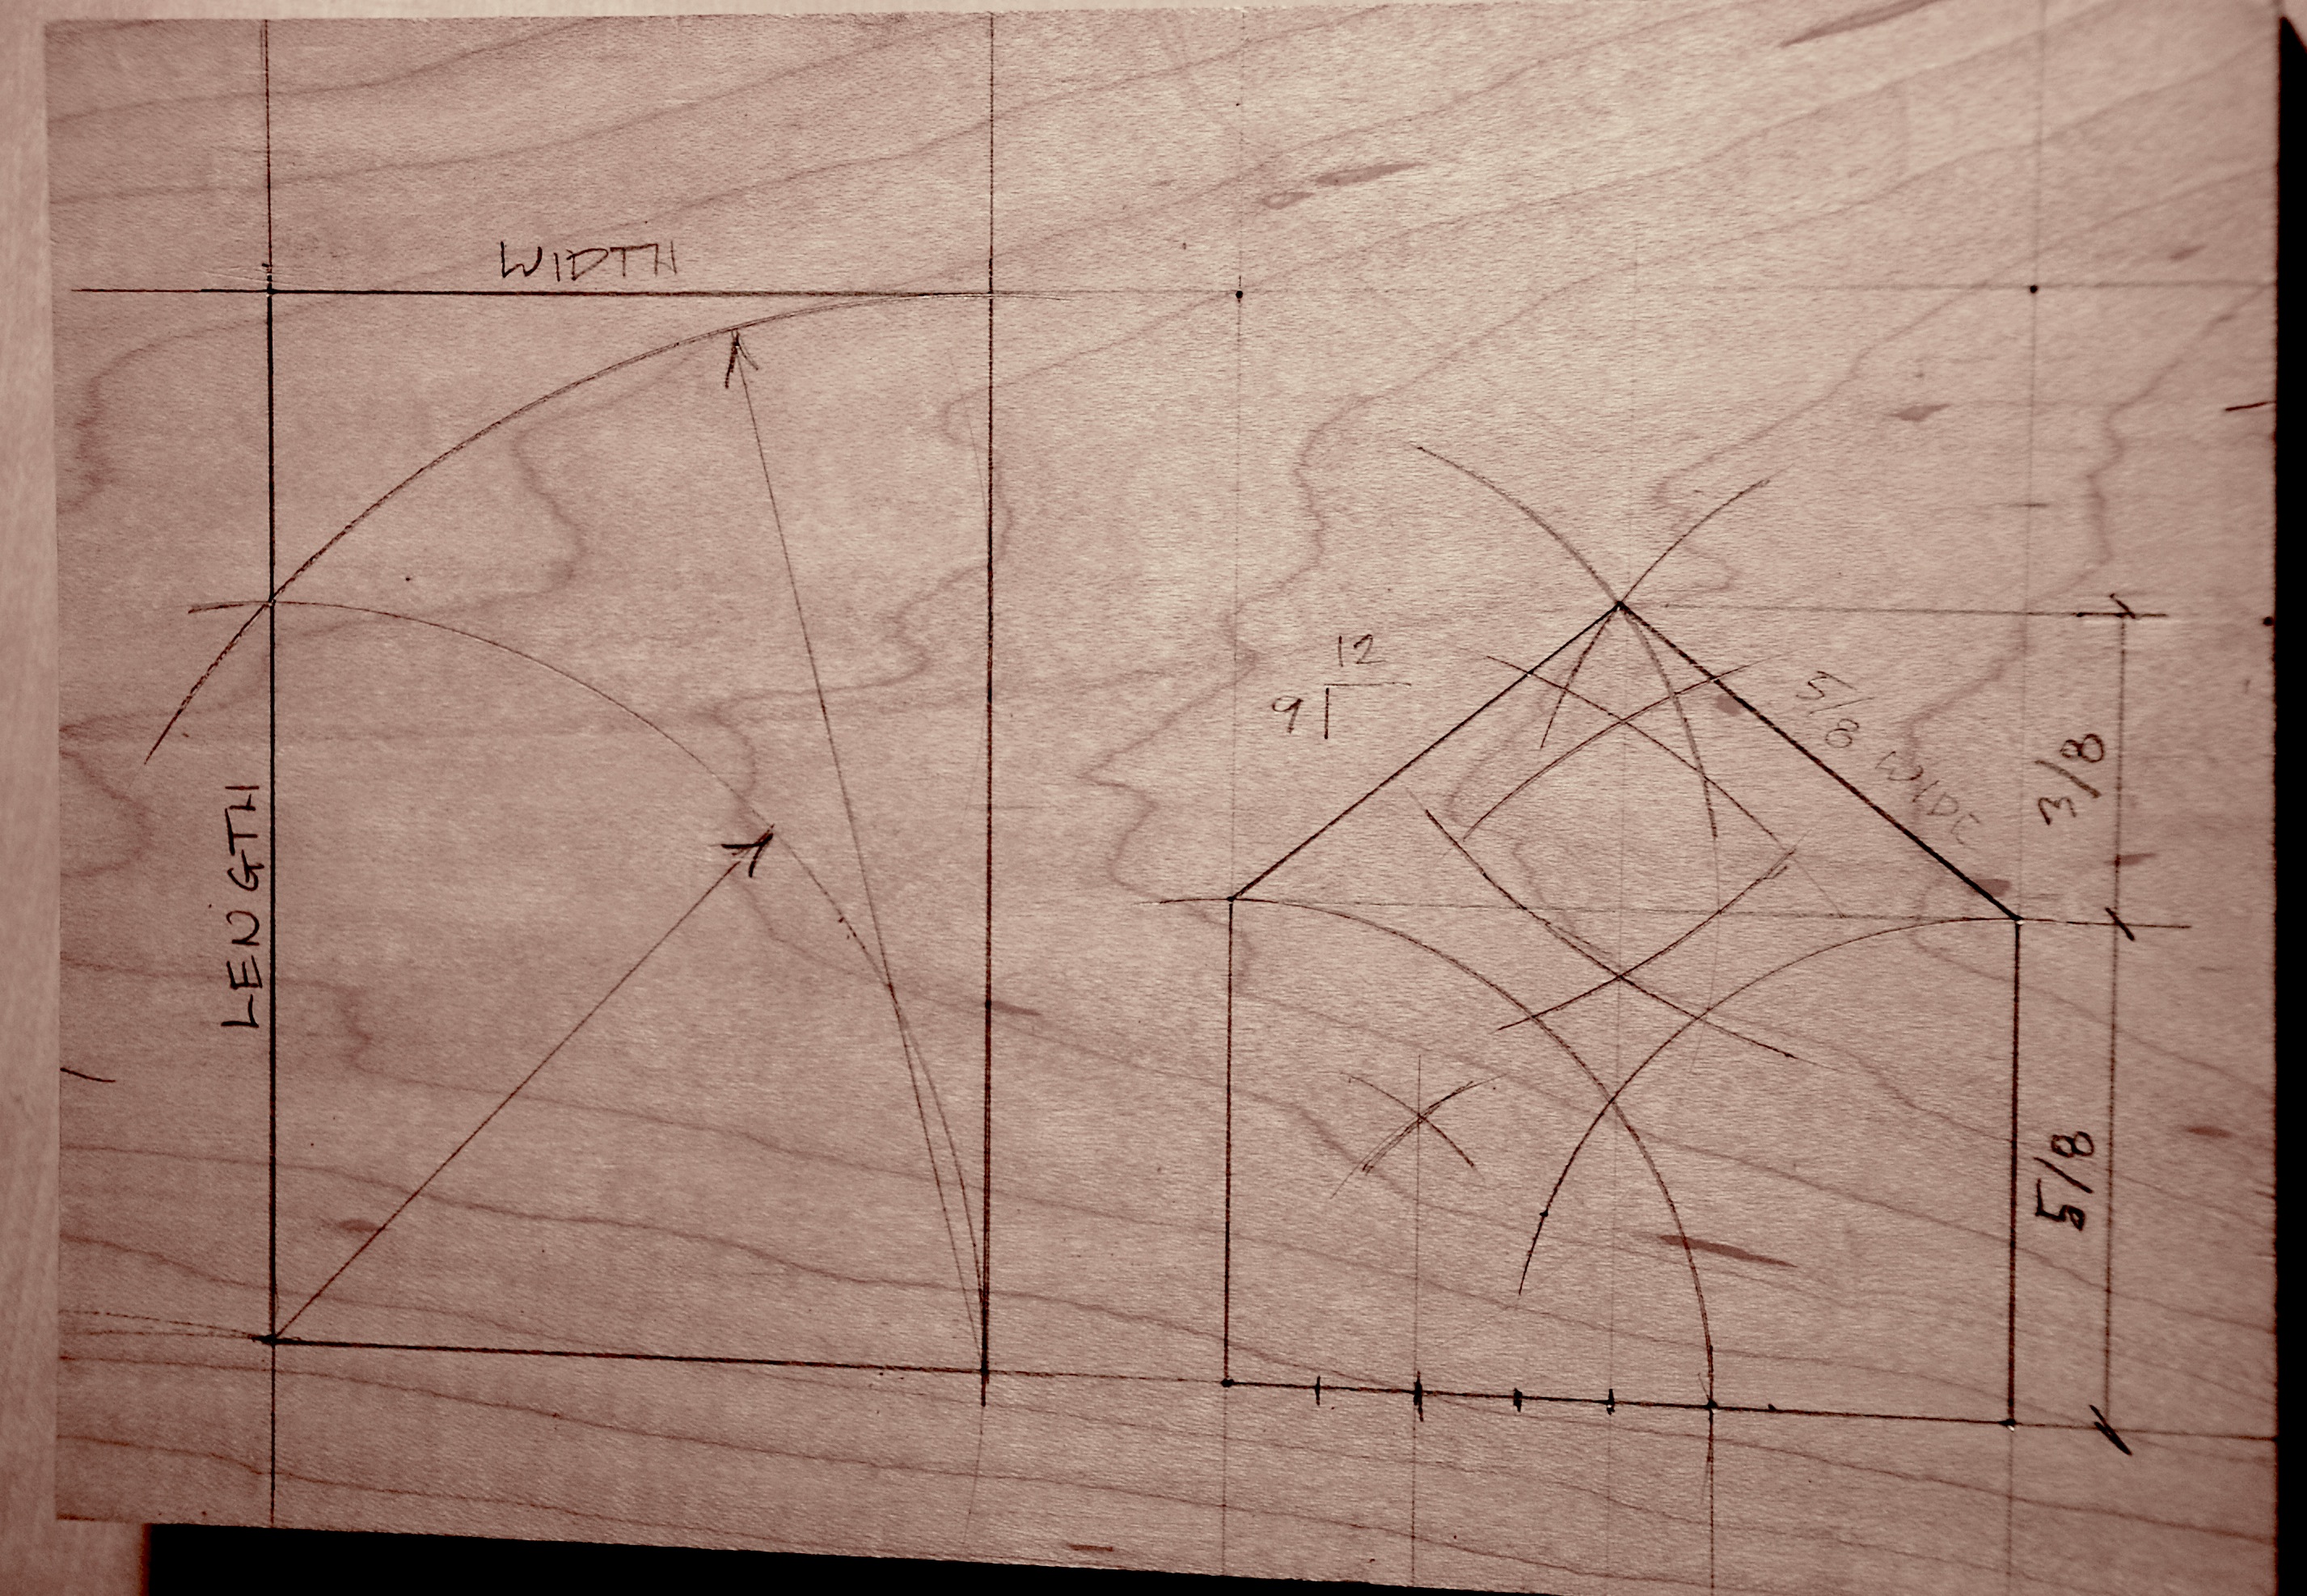
Even an entire structure could and can be built with just a stick and a piece of cordage. Take a hewn log cabin. The picture below illustrates the only drawing you need for a house. It would be scratched out in the dirt with the cord and stick using the cabin width as the main unit of measure.

The length is easily determined in relationship to the width, resulting in a 1.6 plan ratio. The wall height is determined as 5/8s of the width. The same length determines the diagonal roof line which results in a 3/8 rise or a 9/12 pitch. The intersections would be marked with stakes and used as a full size pattern for cutting the timbers and joints without having to use a bevel gauge or fuss with estimating angles.
By doubling the cord the lengths are easily halved into eighths. The metric system is good if you’re working with numbers, multiples of 2 are better if you are laying out a pattern with simple tools.
At one time or another you have probably struggled with a badly proportioned room without realizing it. If you have ever had to design a paneled room and find that it’s impossible to get the panel sizes to work out correctly from one wall to the next, it’s most likely because the room was designed to a bad proportion. Get the proportion of width to length wrong and period details become a nightmare.
By Hand & Eye is now available through the Lost Art Press website. You can order the book here for $34. Also, if you have a peculiar aversion to quality paper products there’s a digital edition available for $16.
Three Types Of Dividers You Should Own
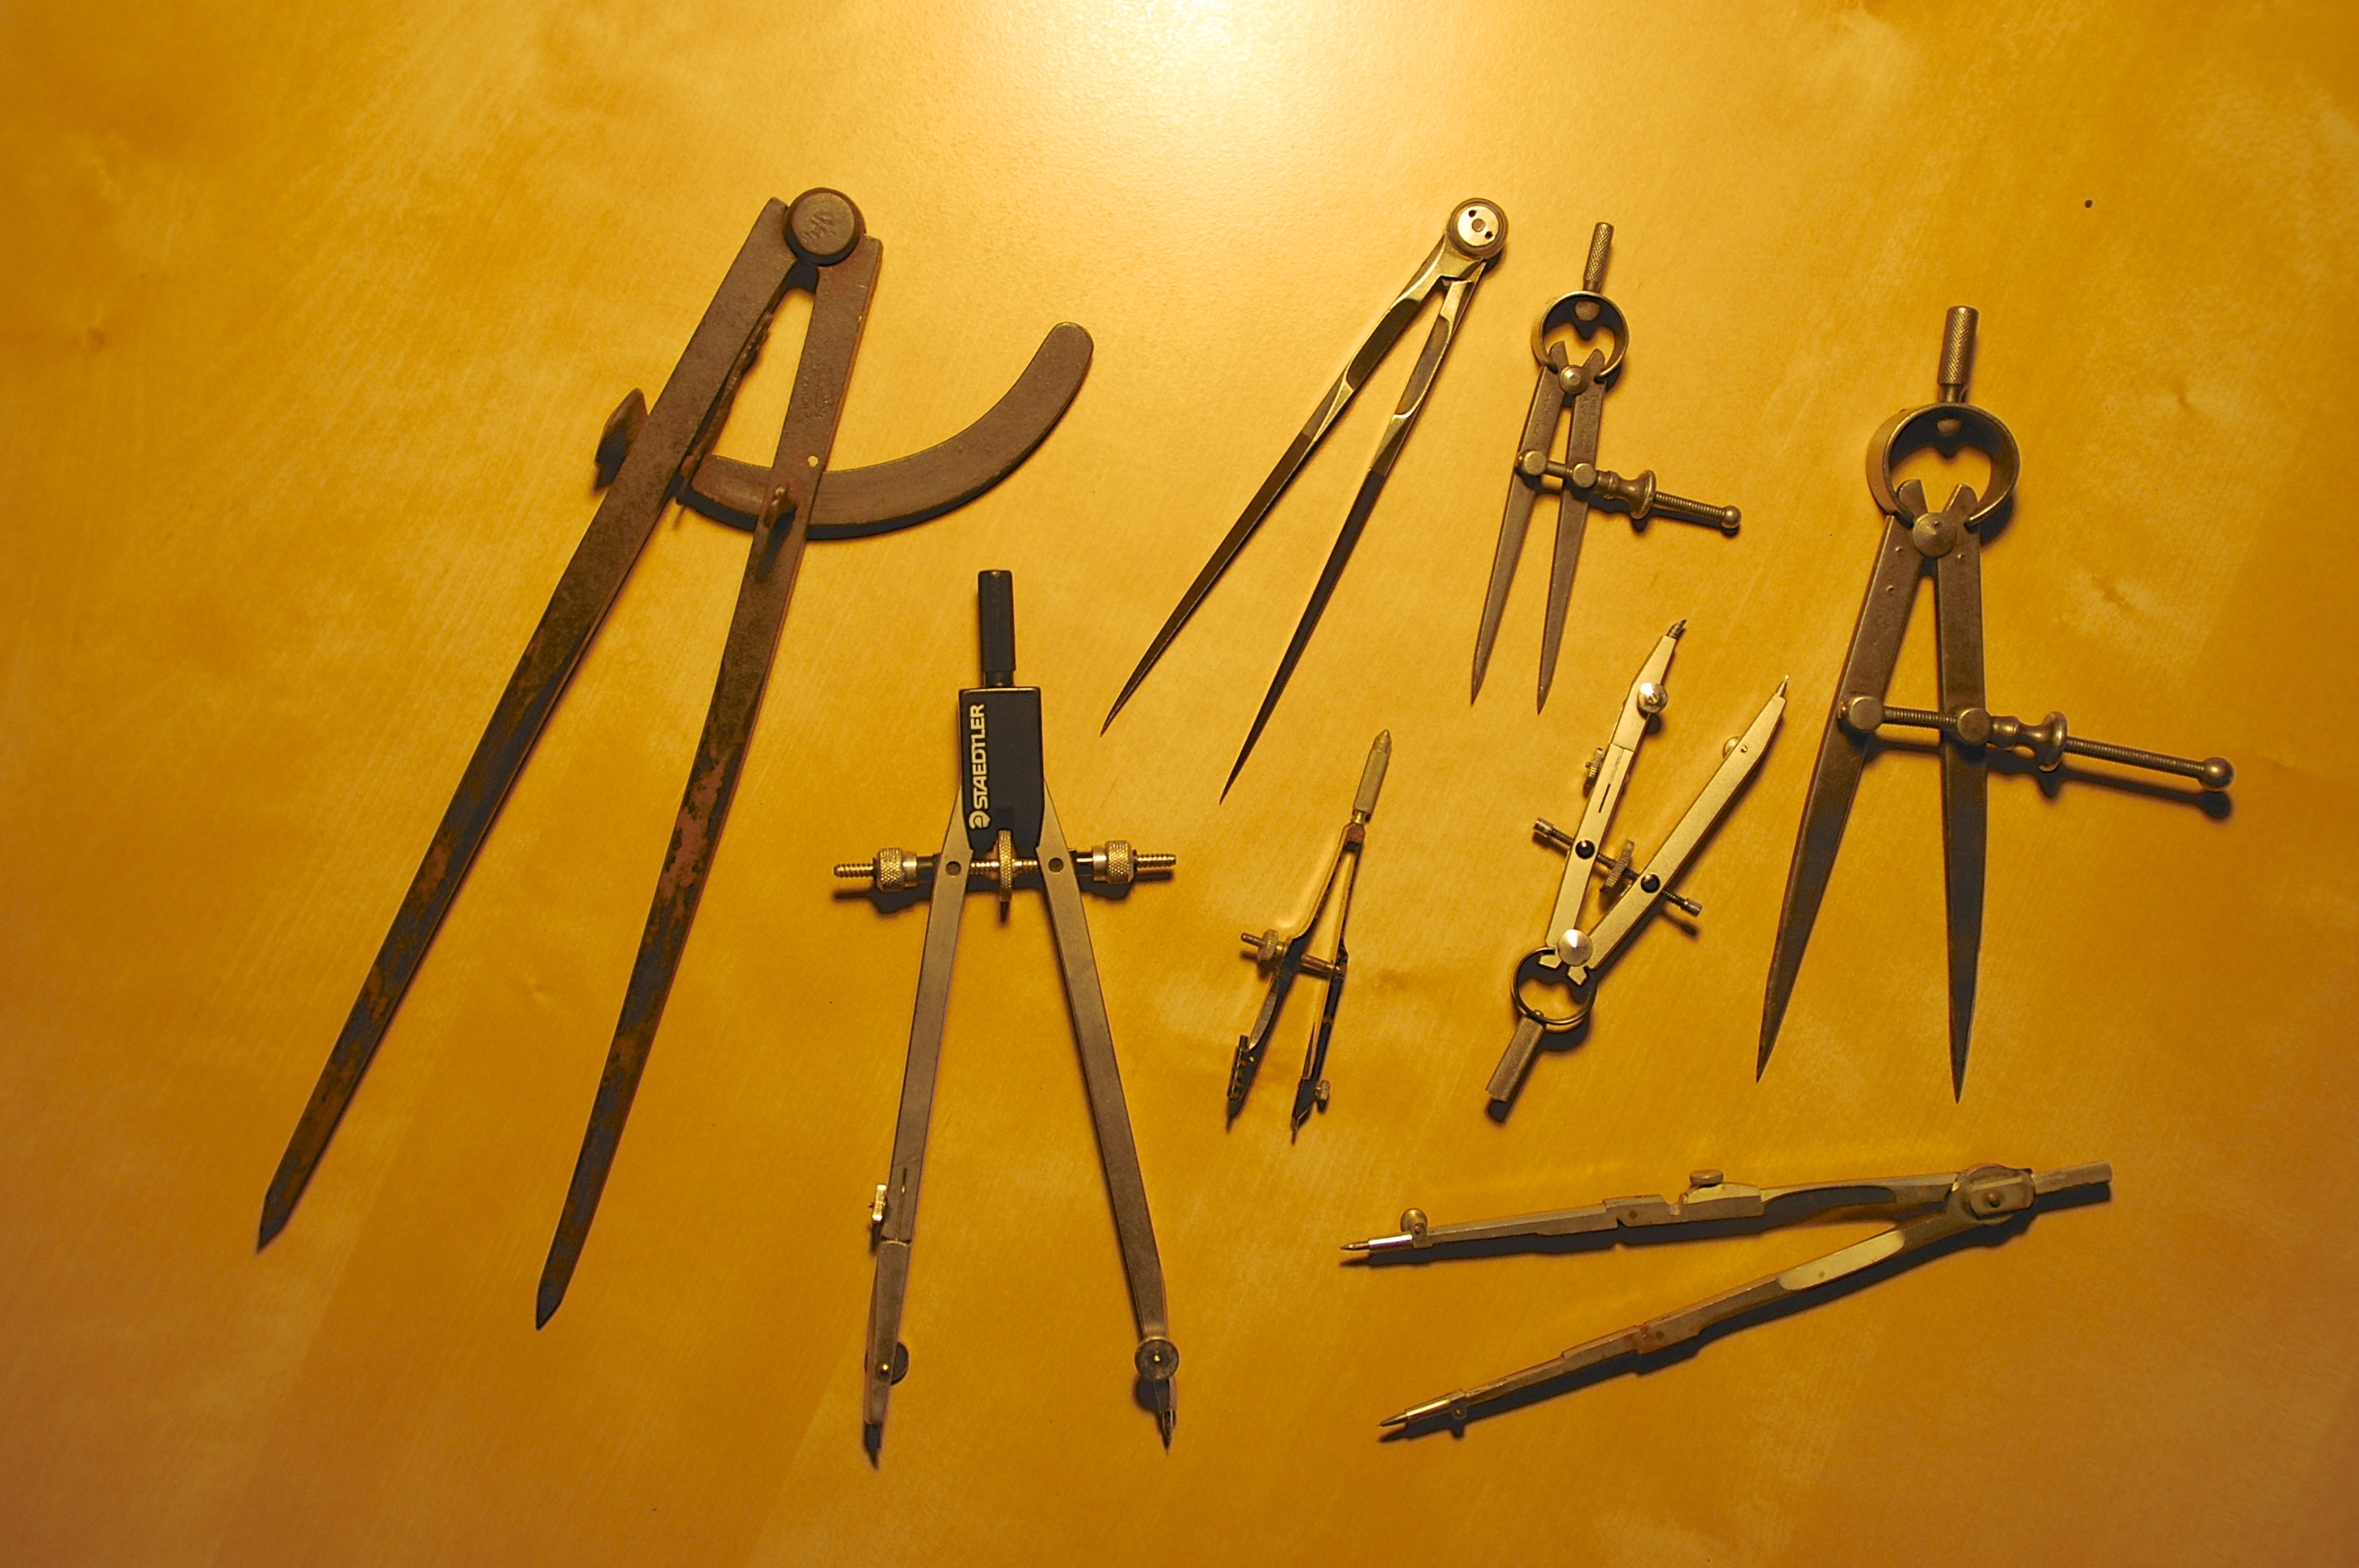
Thinking that you don’t need dividers if you work on a computer is a real mistake. If you have a set of compasses, a set of proportional dividers and a set of equal-space dividers you can accomplish a lot of things in less time than it takes for you to start your computer.
Here are the three types of dividers you should have and where to find them.
Compasses / Dividers

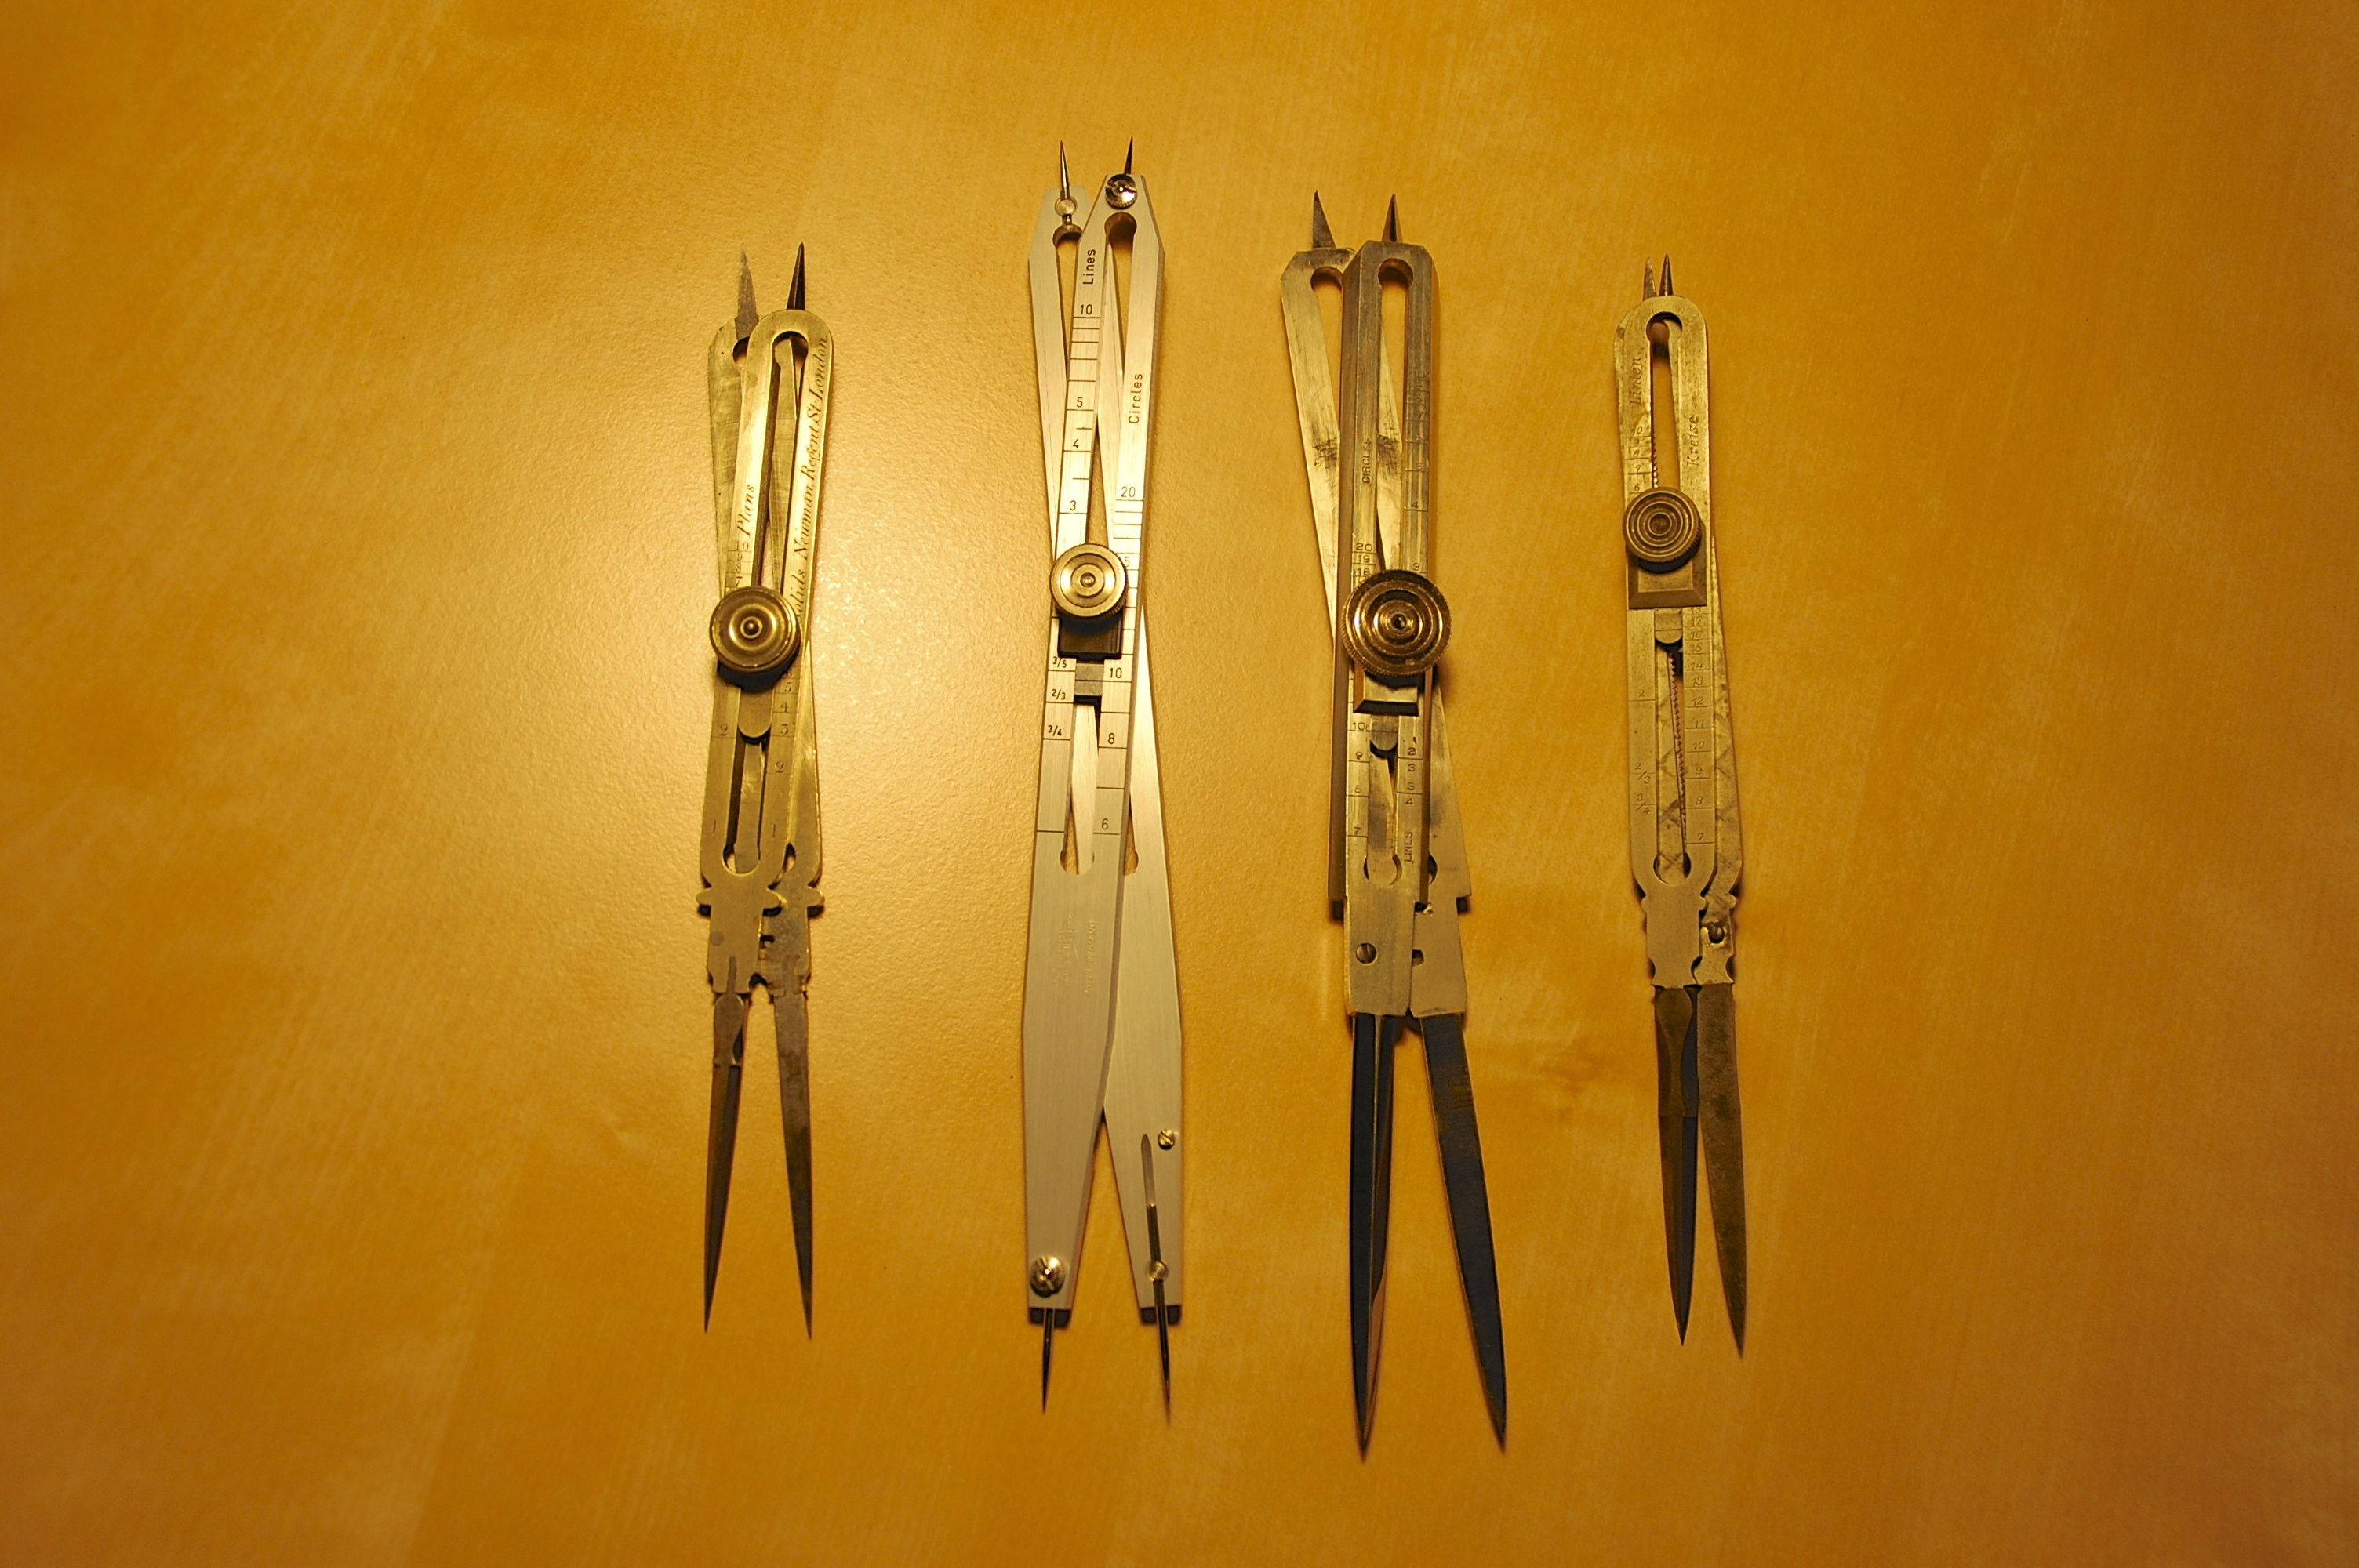
There are a large number of compass and divider styles available. You need to find the best type to fit your work methods.
Dividers and compasses are both the easiest and cheapest of all three types to find and have the greatest variety. If you are just doing the exercises from the book or doing small design drawings on vellum you only need a typical compass. You don’t need to settle for a cheap office store/elementary school type, there are plenty of quality compasses available on Ebay for as little as a few dollars. Usually they will come as part of complete drafting sets, which aren’t a bad thing to own, but often you can find them as one-offs. A compass around 6″ in length should be all you need. If you are feeling like drawing something larger, you’ll need a beam compass. I own one like this which is the best I have ever found. It’s called a Feranco Beam Compass and it was made by a small firm in Cincinnati. They’re out of business but you can find them second hand. Or, you can use a metal straight edge with a set of trammel points like these.
Proportional Dividers

proportional dividers come in a number of styles, most will work for design except for the type manufactured for nautical calculations.
These are definitely more expensive than a set of dividers but are a huge time saver if you are trying to scale a drawing to a different size or want to design to a giver proportion. The cost for a set of these will run anywhere from $30 to $300 depending on the vintage and make. The pair on the left are a 1810 pair made in London. The legs are of iron which are dove-tailed into the German silver body. The tolerances are very tight on these dividers and they stay put when you set them which is often a problem with cheaper dividers. The vintage sets have points which are triangular in shape and come to a very sharp point, which they need to be. Dull points require tuning with a very fine file or emery cloth. This should be avoided if possible because the accuracy depends on the lengths of the legs being a definitive ratio to each other. The modern sets have round pins which come to a point. The advantage of this being that if the dividers are dropped the pins can be replaced, something impossible with traditional sets.
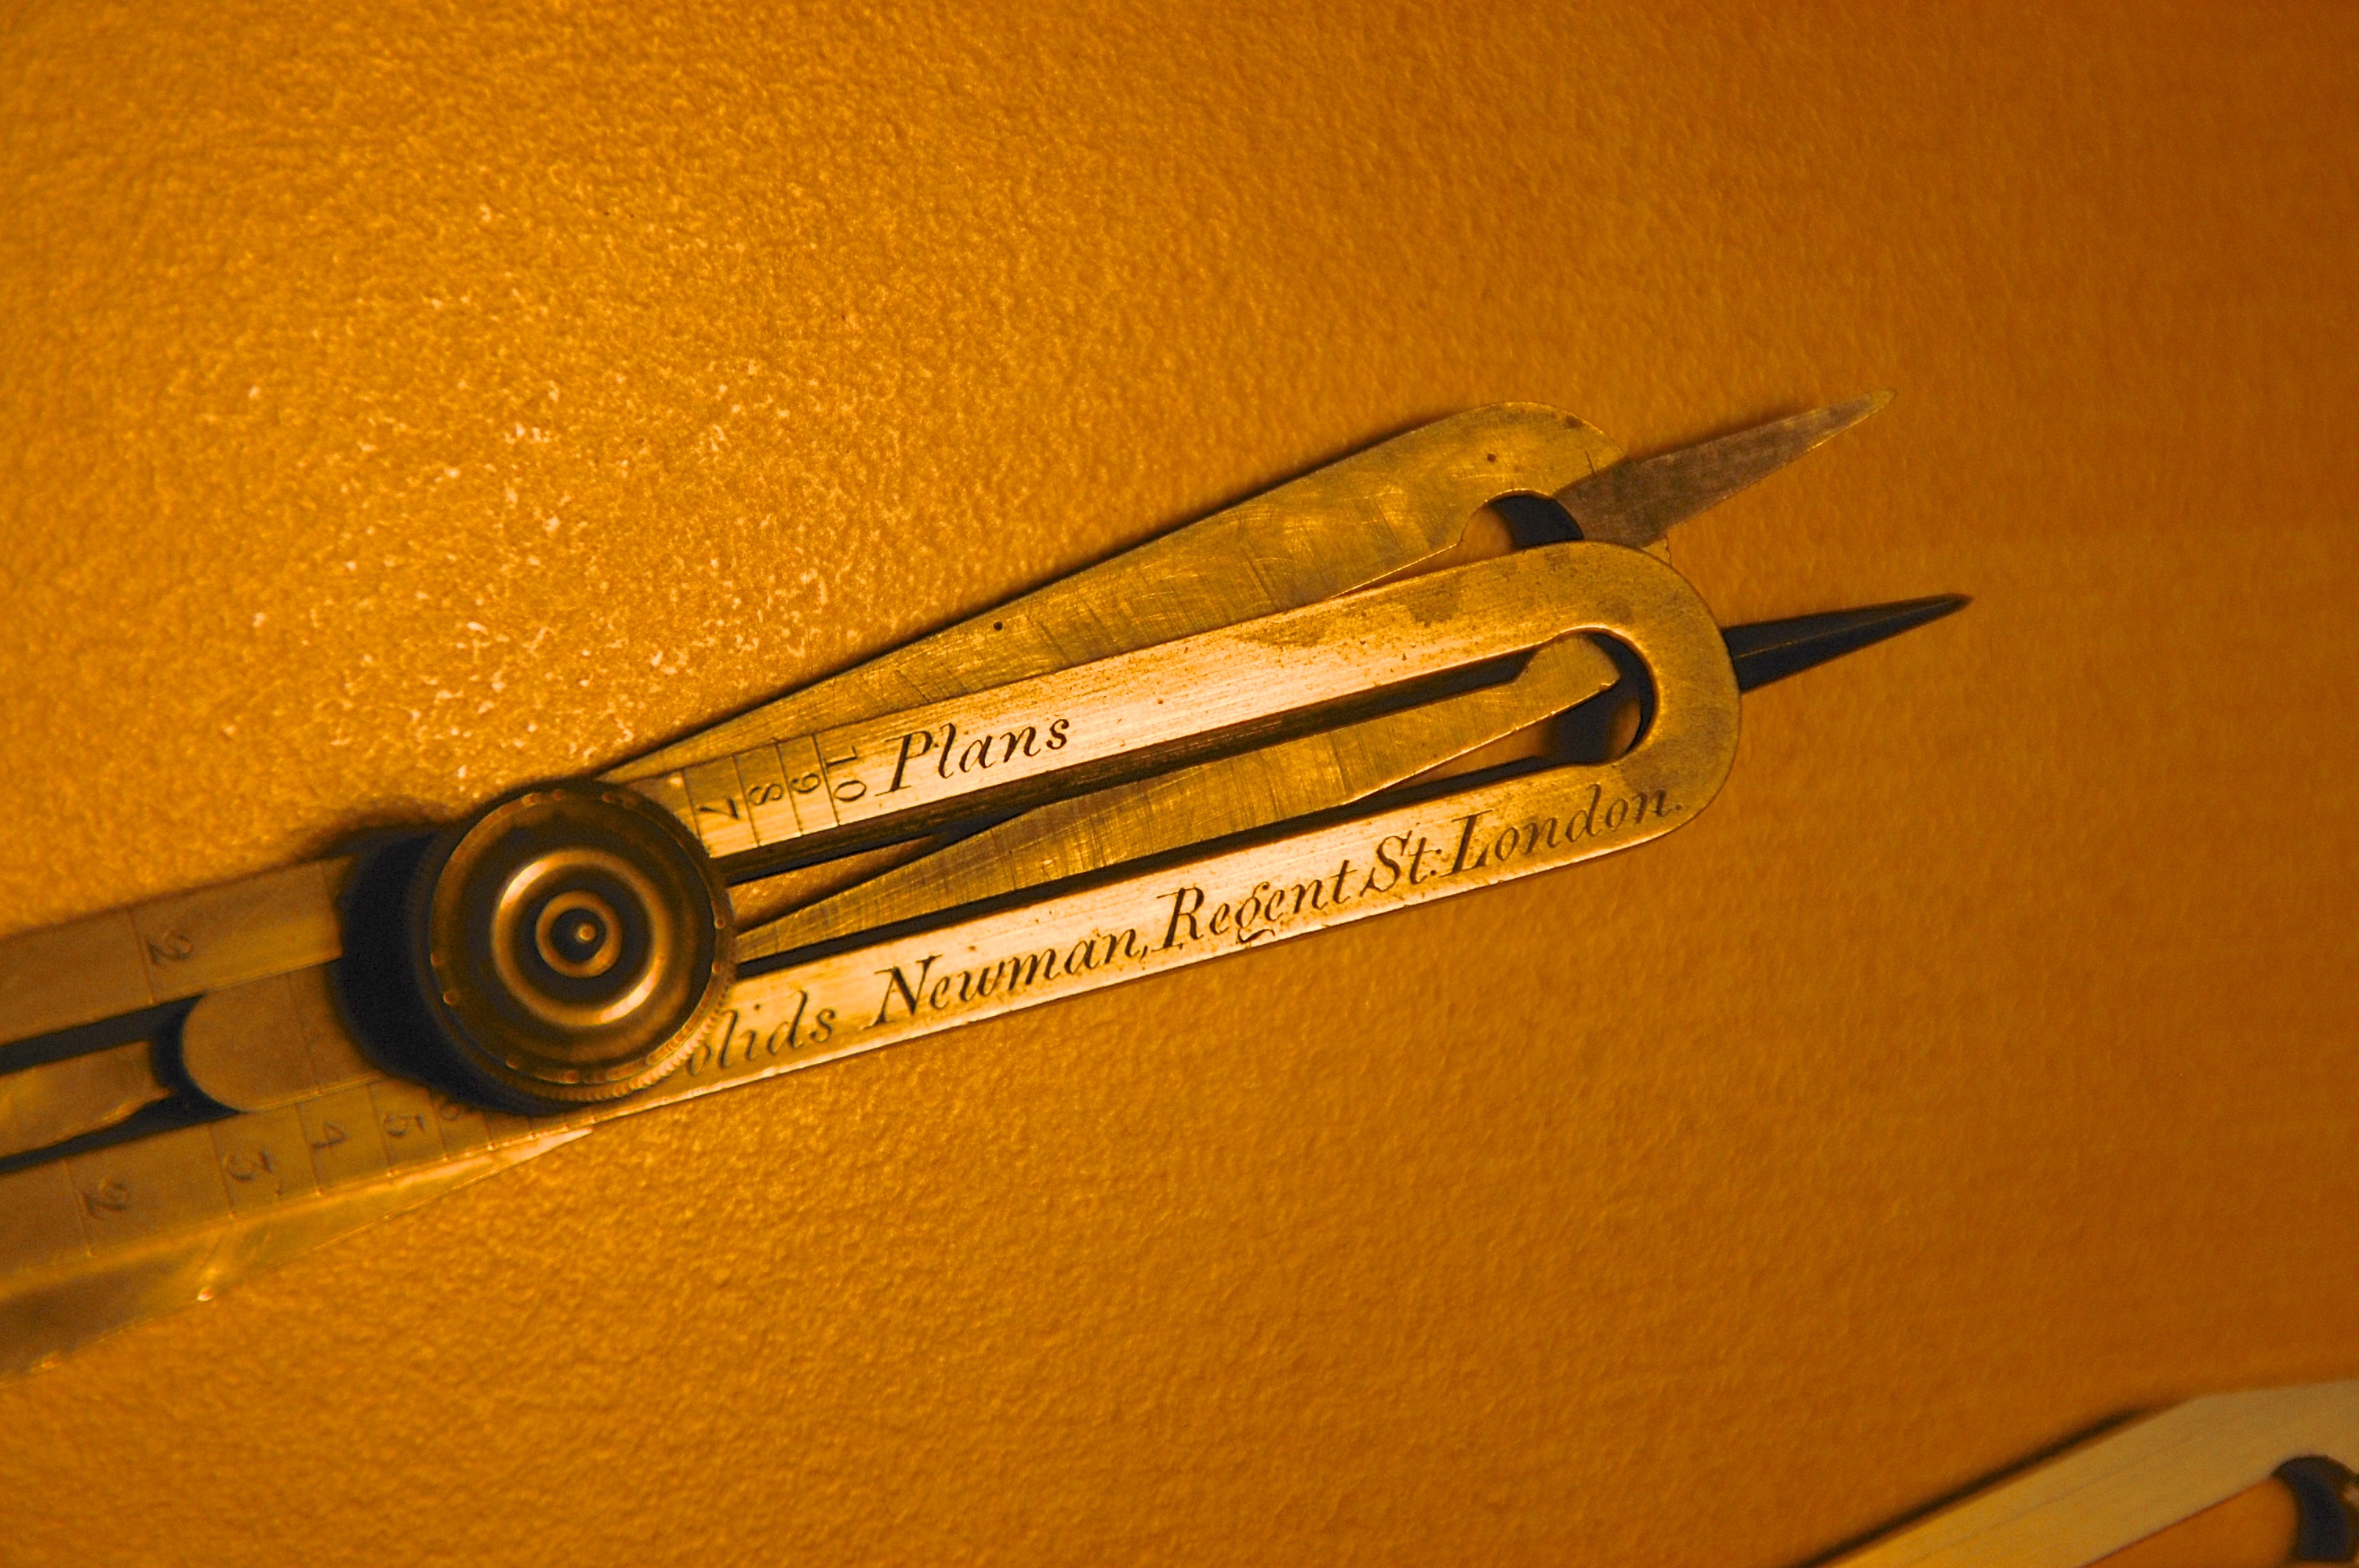
The vintage sets came in two types: standard or second quality in which the indicators ‘Lines’ and ‘Circles’ are engraved on the front, and first quality in which besides these the indicators ‘Plans’ and ‘Solids’ are engraved on the reverse side. For 2D line work you only need the first two indicators. Also, when you are looking for a used set, be sure that one of the indicators does not say ‘Speed”. These are a pair made for nautical use and won’t be very useful for our purposes.

The better quality sets had designations for solids and planes which are for volumetric calculations
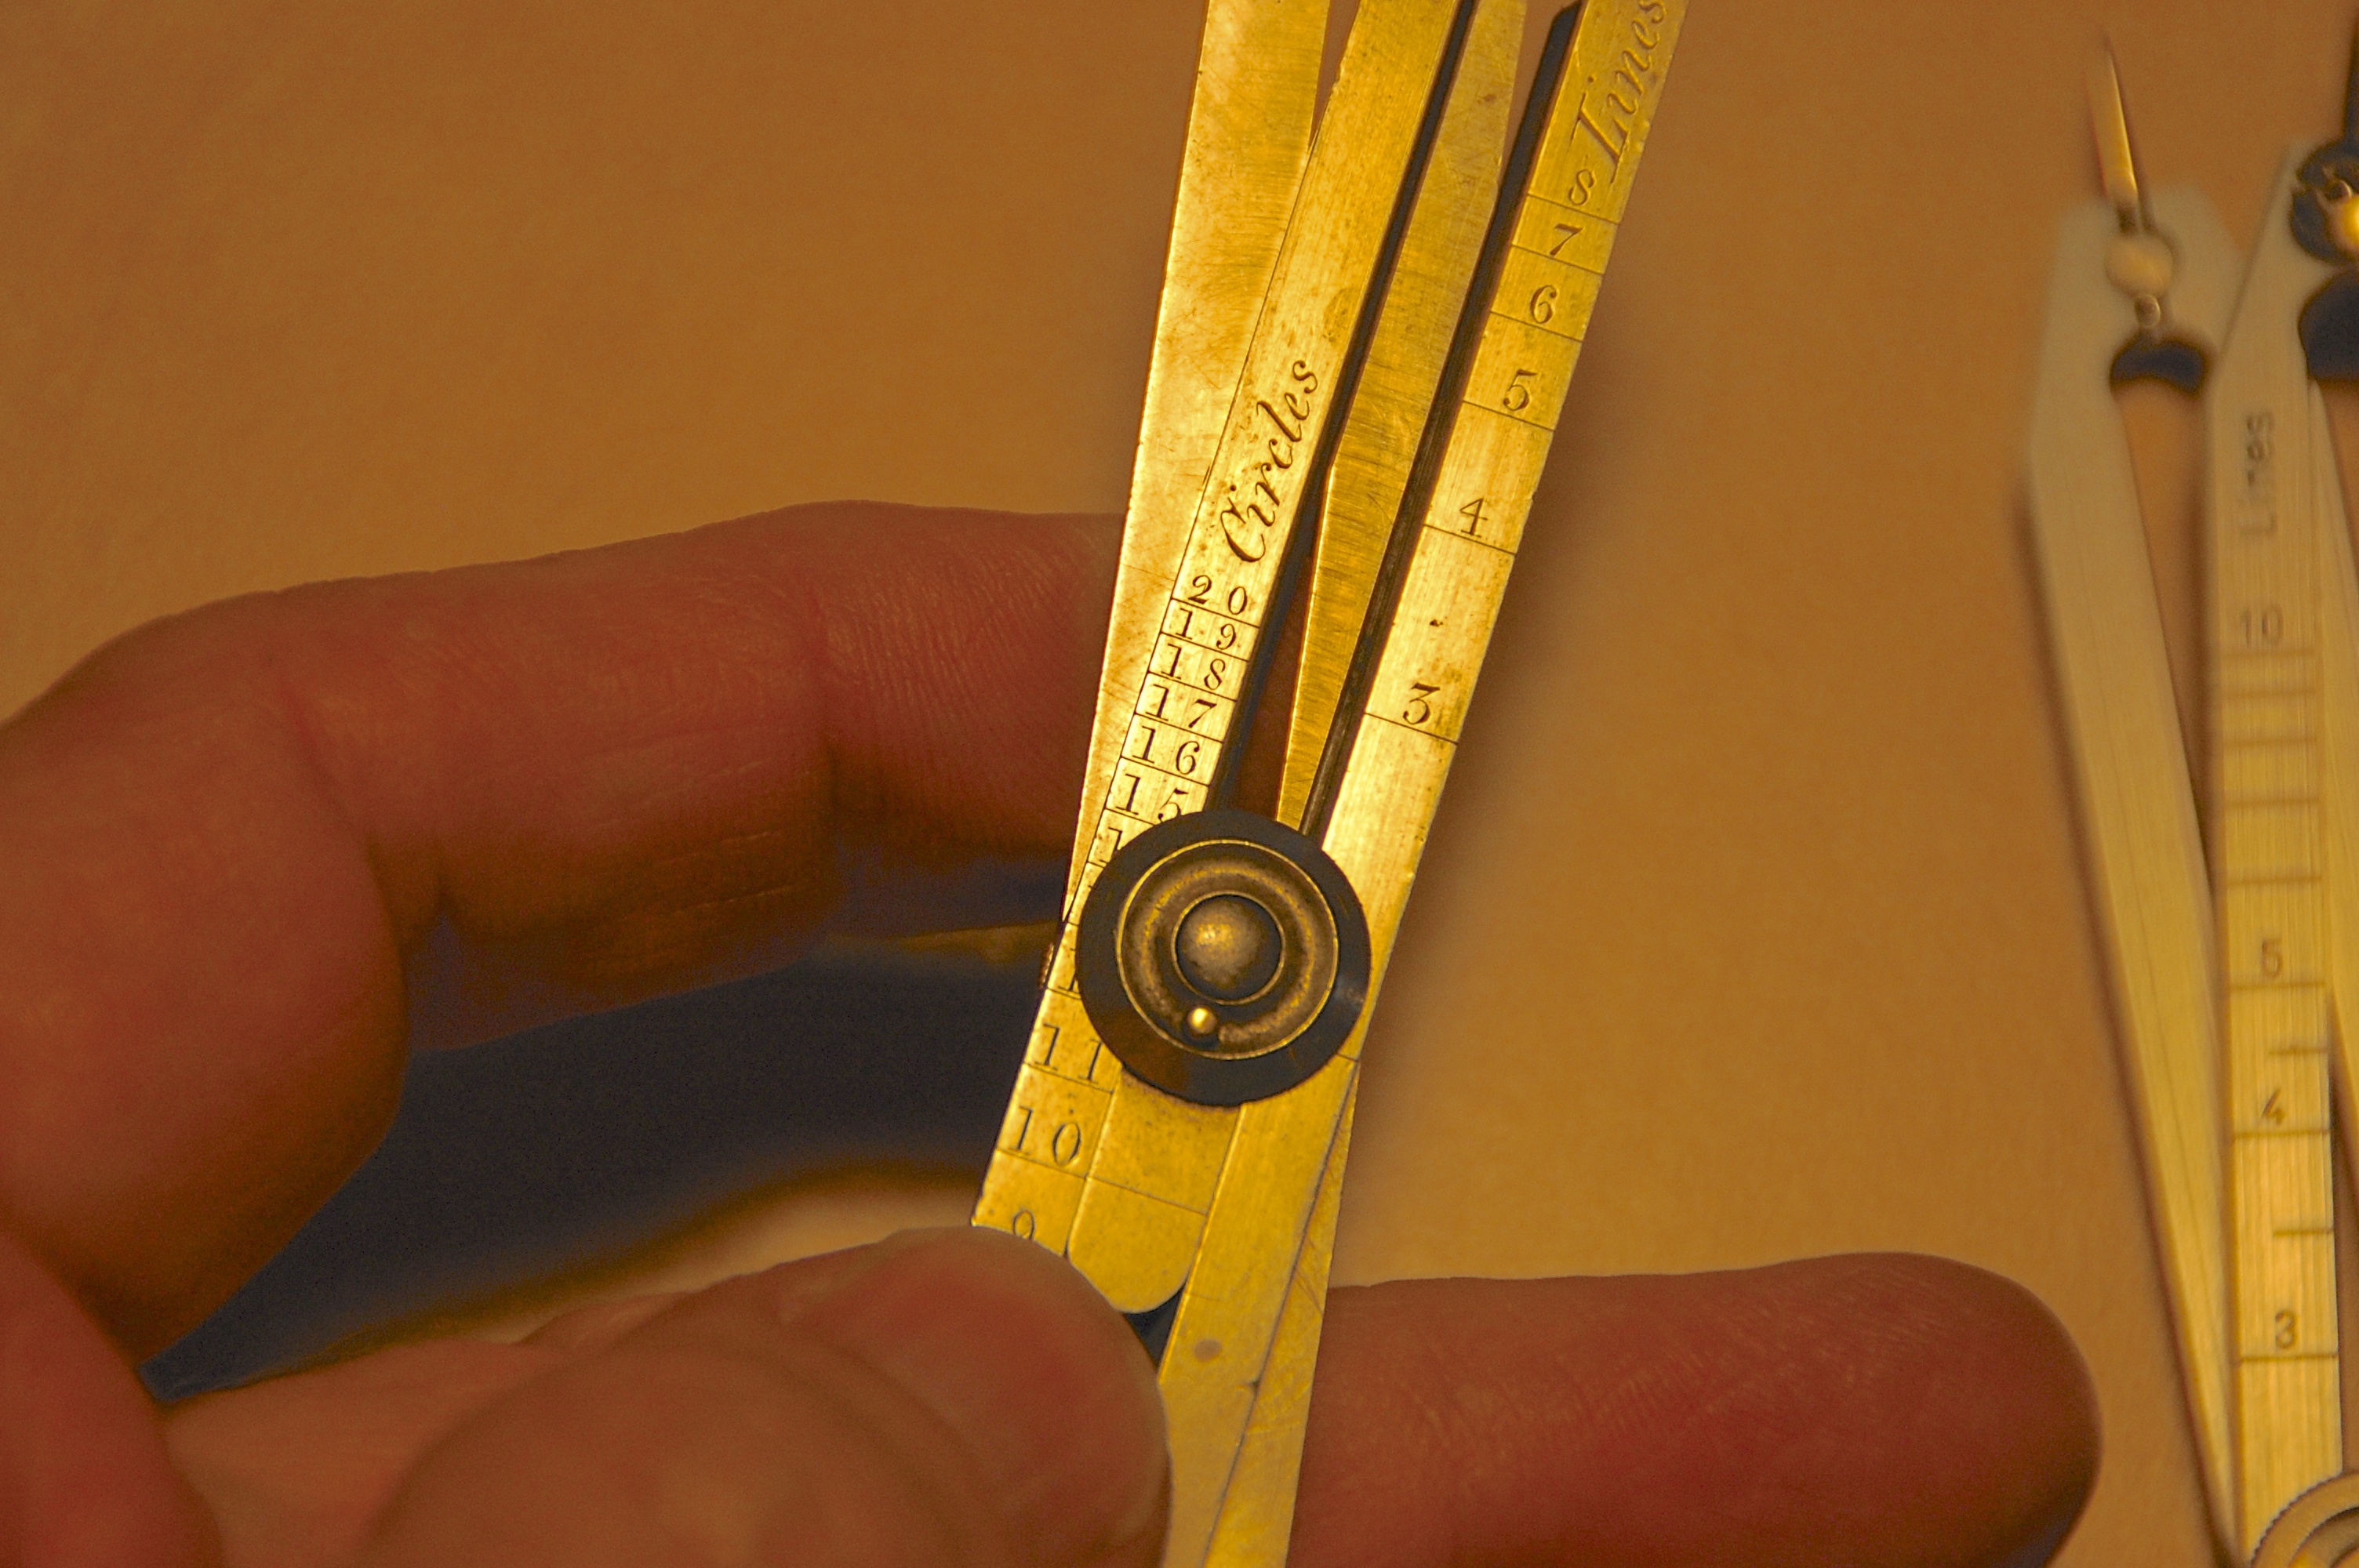
When you set the dividers to a ratio, the difference in distance between the longer and shorter legs will mirror this. Set the ‘Line’ scale to 8 and then spread the long set of legs along a straight line. The distance between the short legs will be 1/8th the distance. The same method works with circles. Set the scale to , say 5, and them spread the long legs across the diameter of a circle. You ‘walk’ the legs around the circumference of the circle to divide it into 5 equal segments.

The ’10’ setting under circles gives you the ratio for the Golden Proportion.
If you like designing to the Golden Proportion, you can set the Circle scale to ’10’ and you will have a proportion of 1.618 between the two sets of legs.
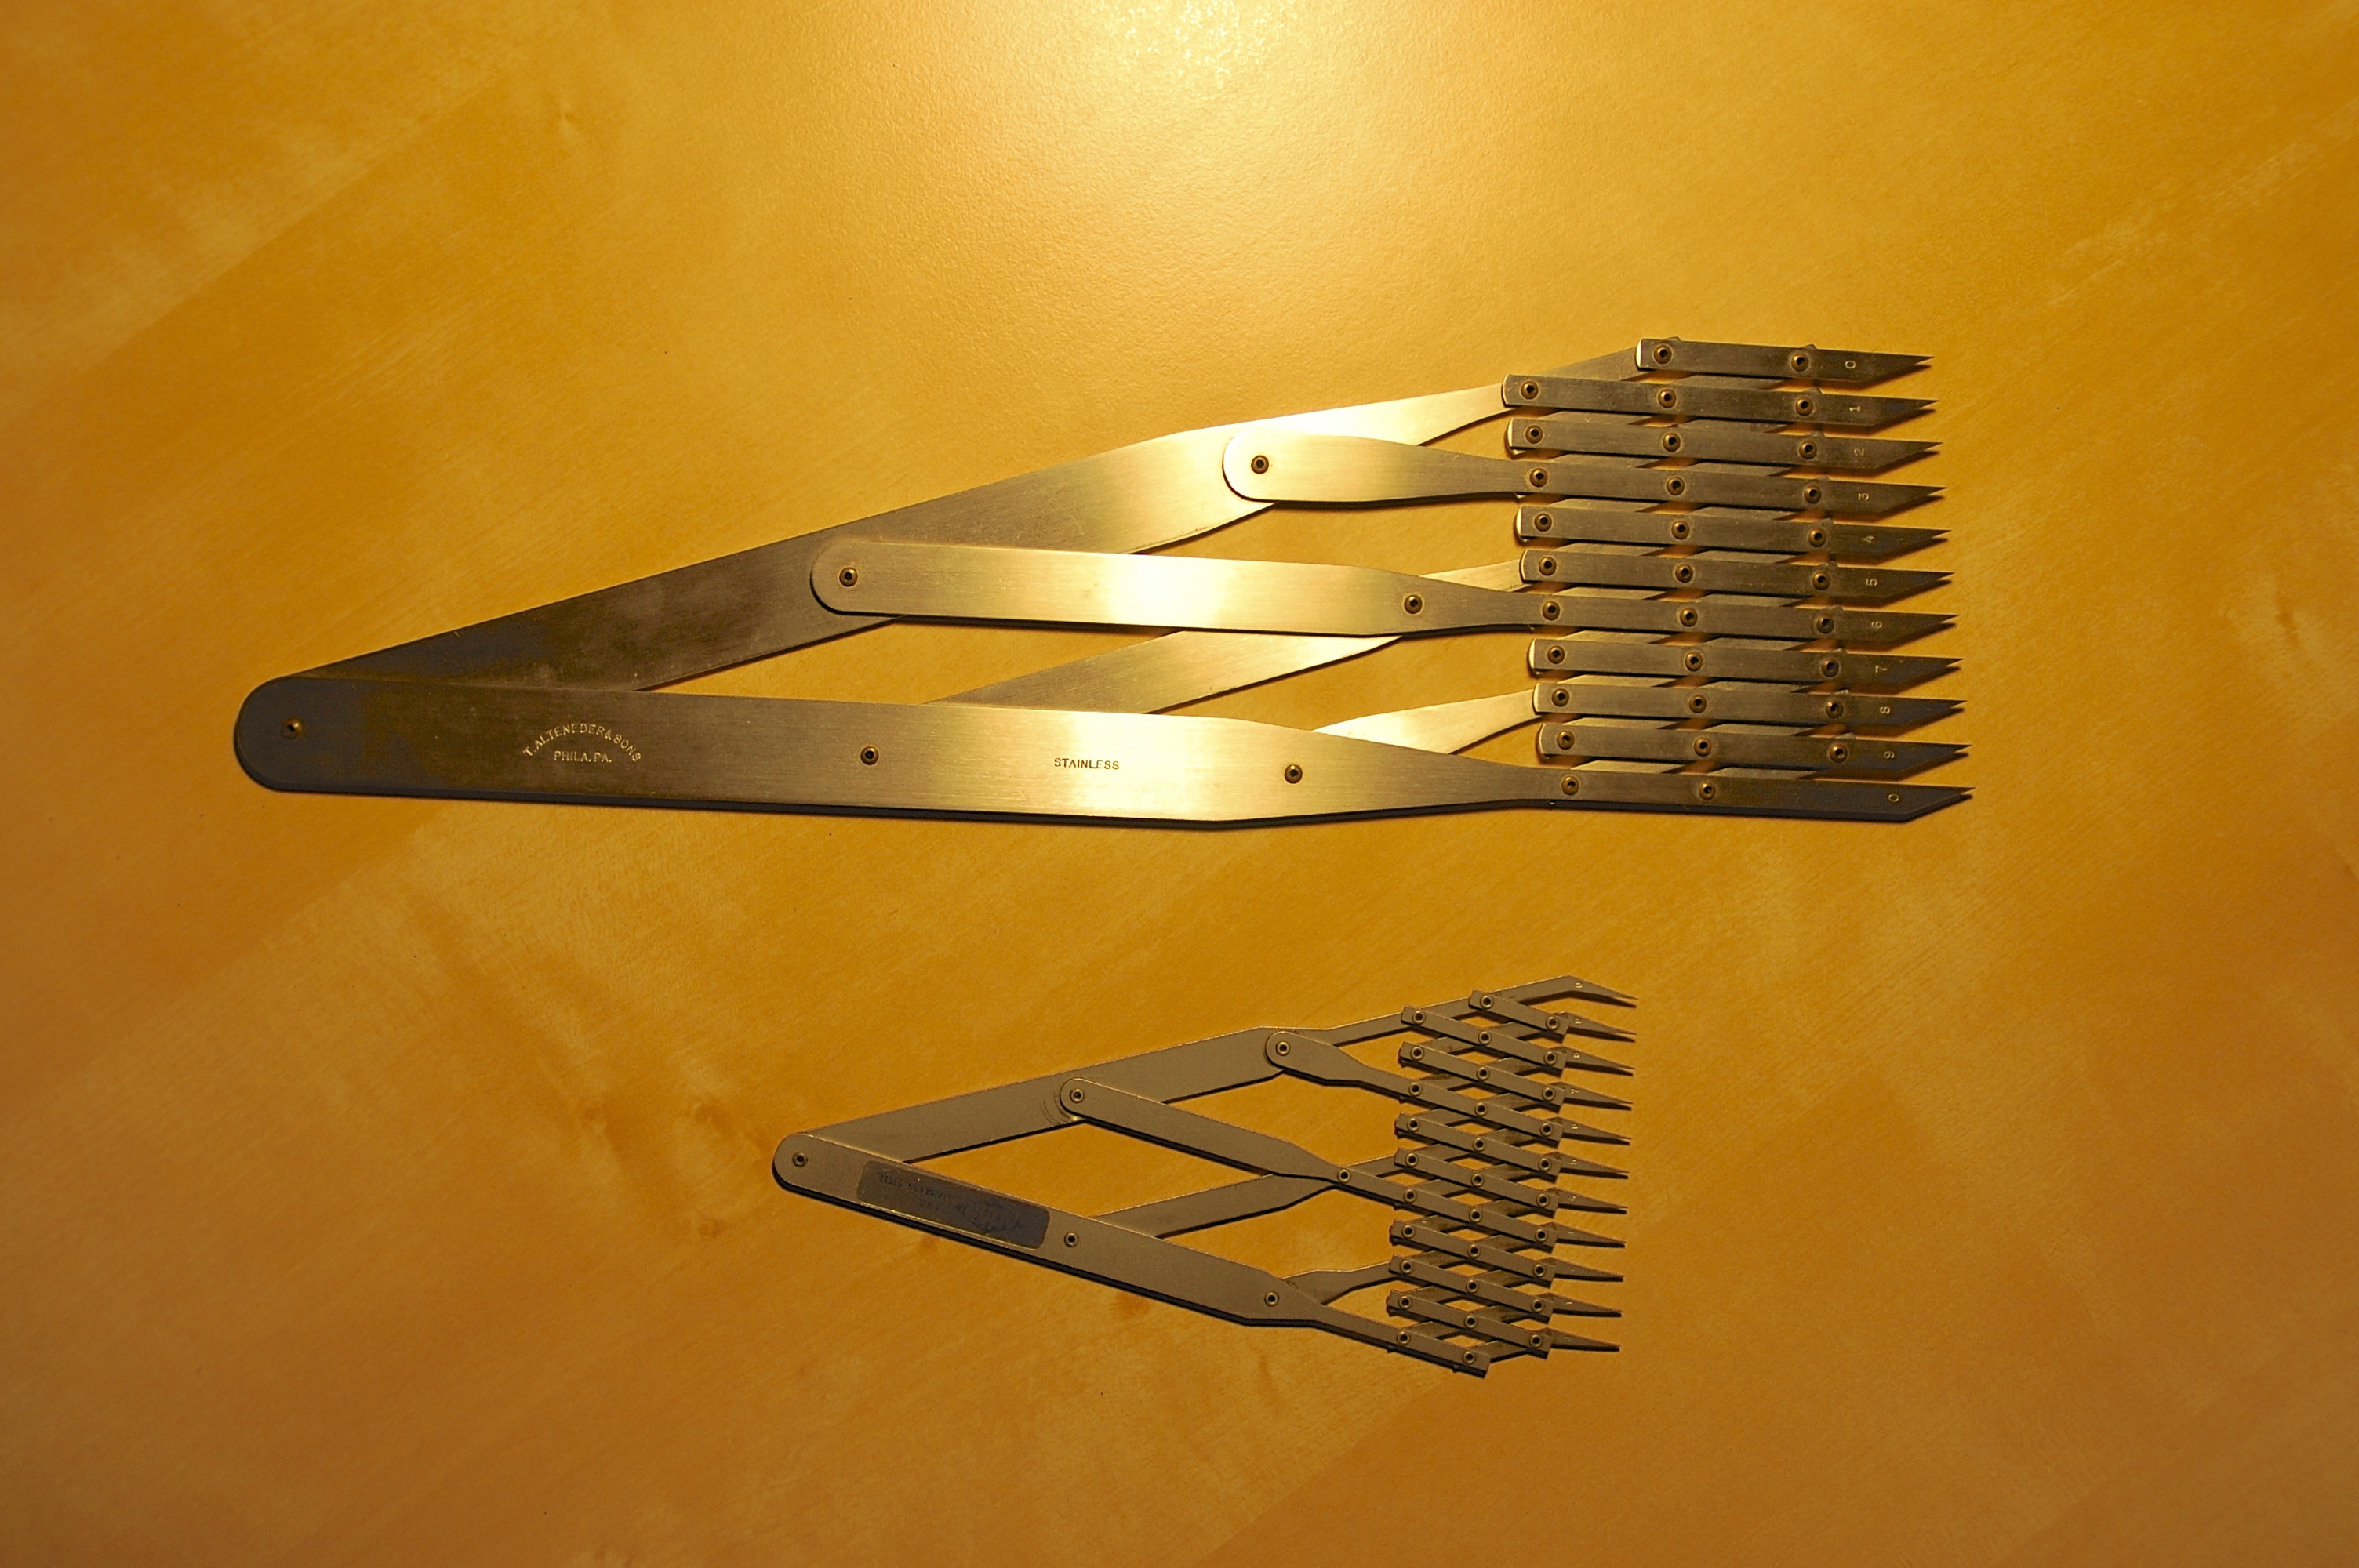
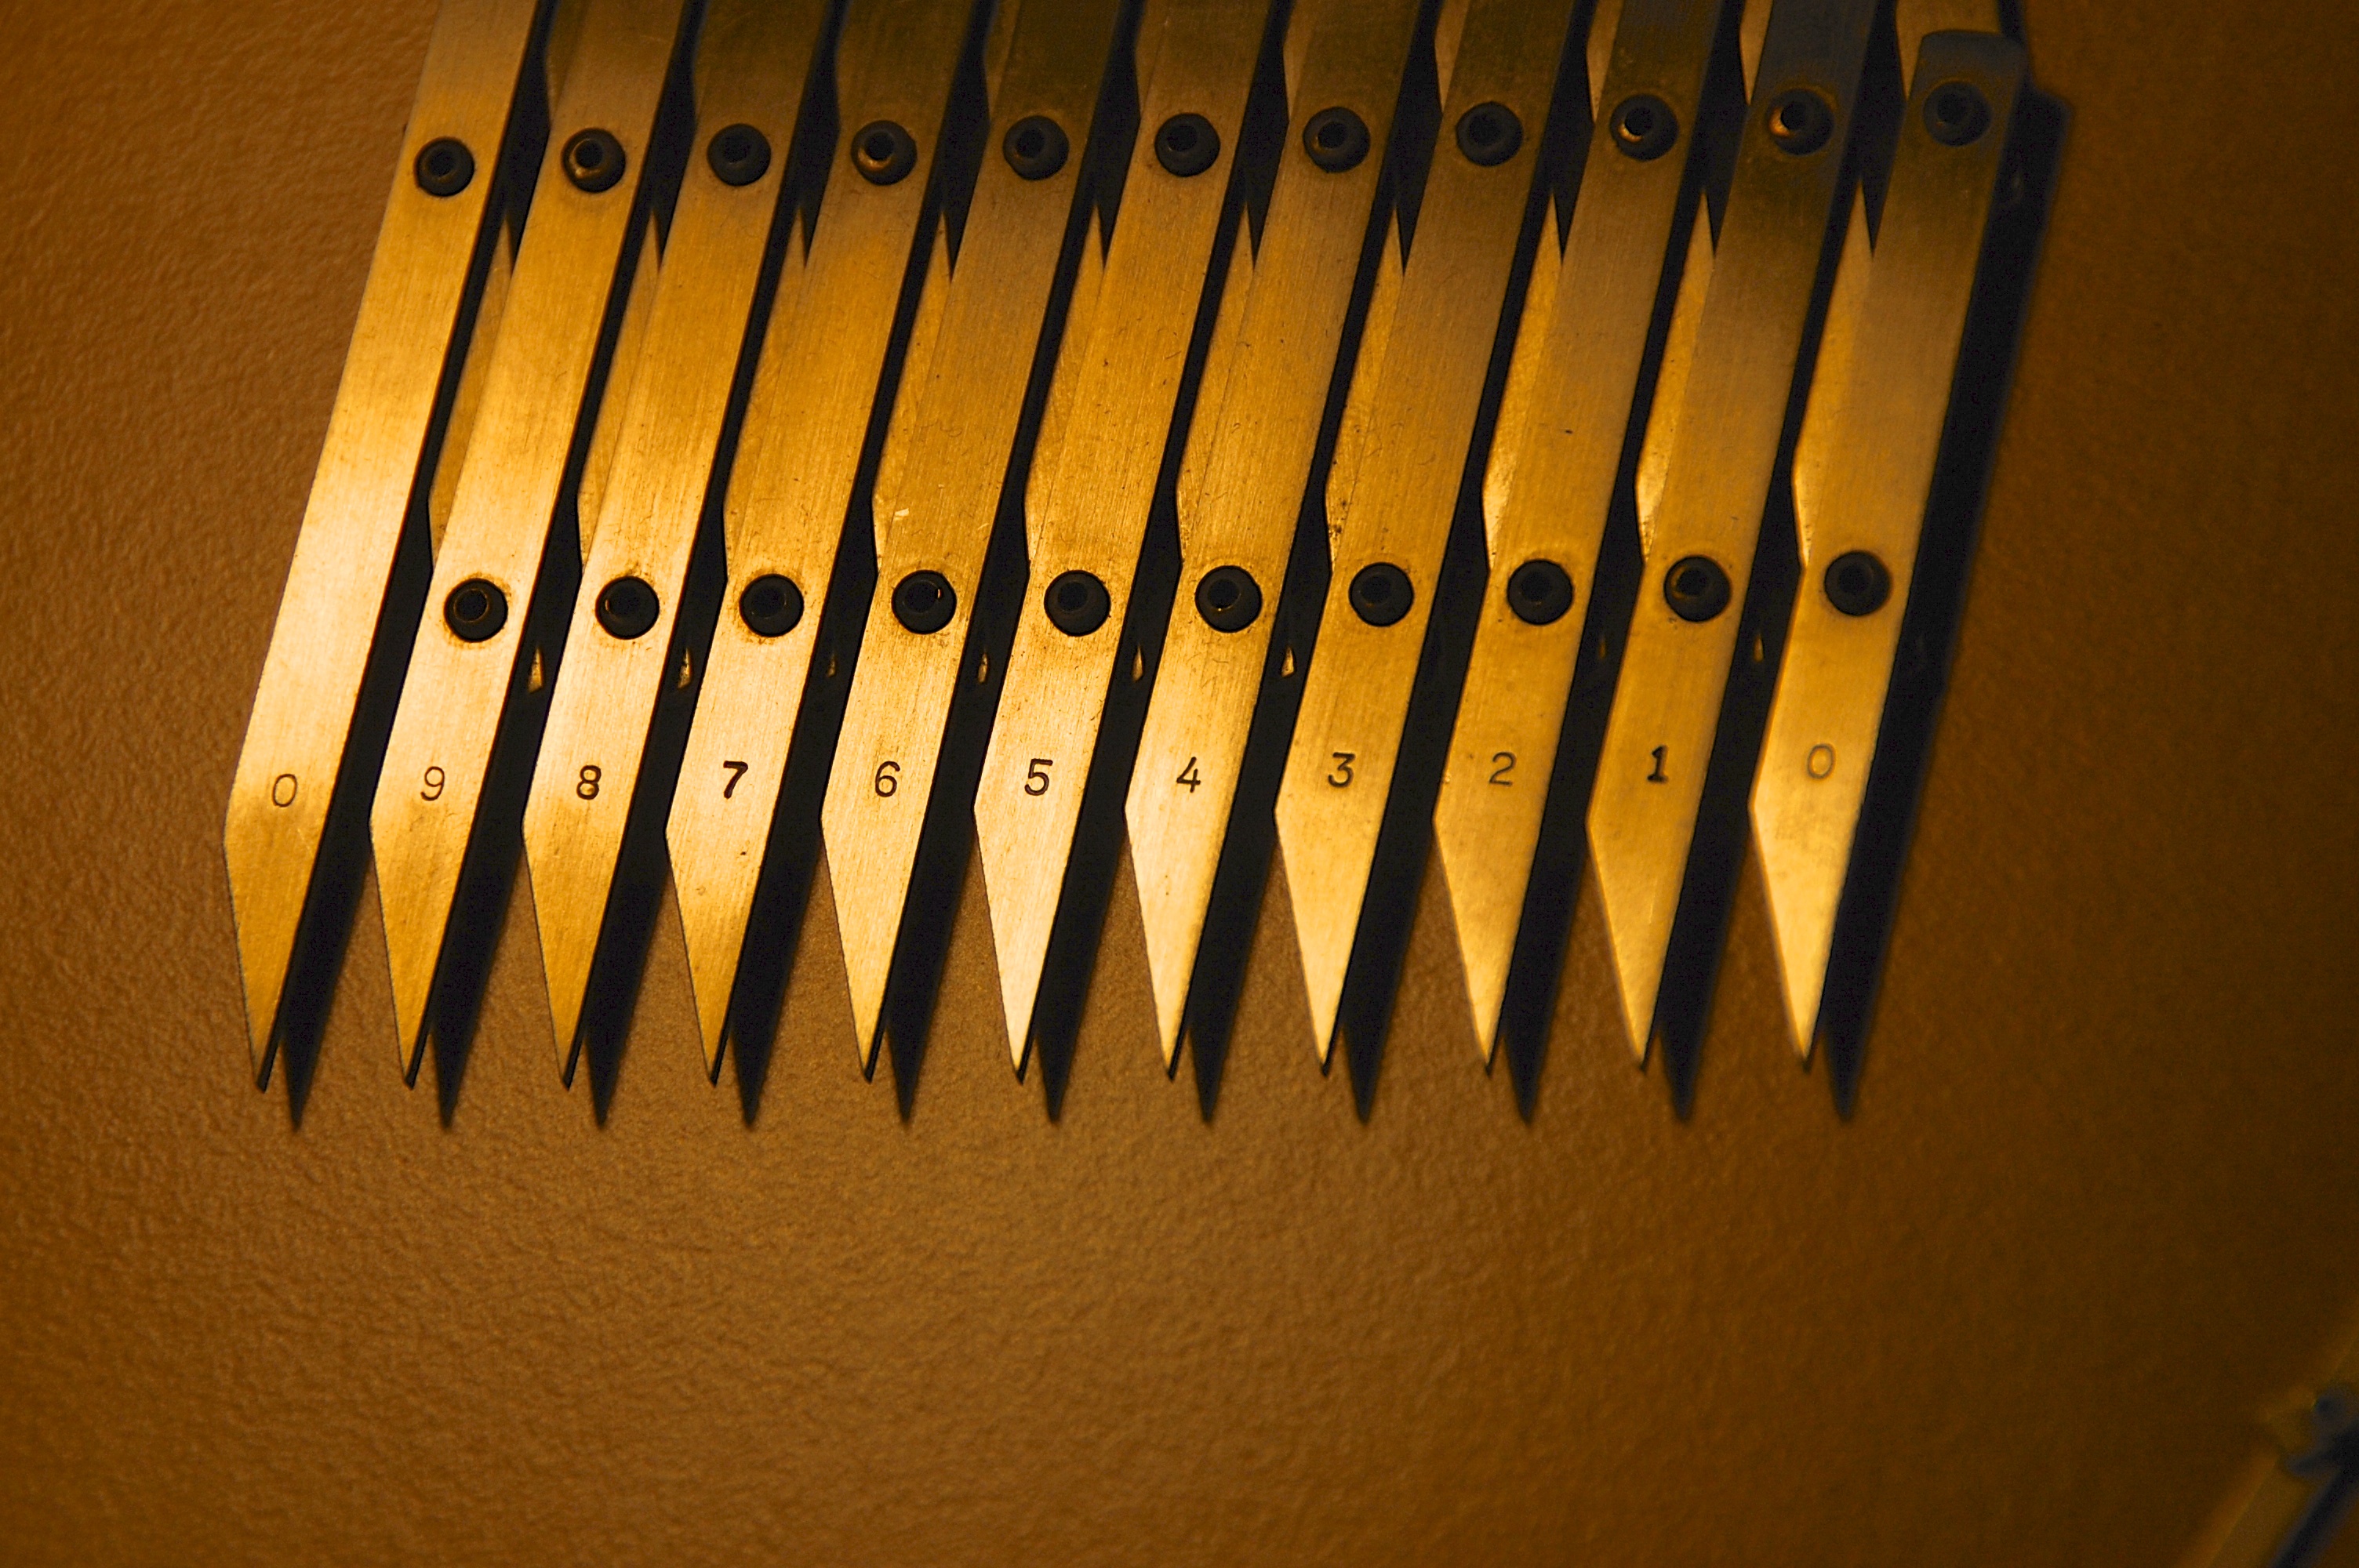
Equal Space Dividers

Equal space divider come in two sizes: 6″ and 12″
This type of divider is the most expensive of the three, but for scaling or proportion work from drawings or photographs they are impossible to beat. These are the dividers I use the most of all I own and if I lost them I’d have to replace them immediately, despite the steep price. I bought my set decades ago for $130, new now they list for $350. Ouch. My 12″ set were handmade my Alteneder & Sons in Philadelphia and are collectors items. You may get lucky and find a pair on Ebay. New, a 12″ pair runs from $400 to $500. I’d recommend finding a second-hand pair but make sure the tips are not bent or the accuracy will be nil. These dividers are sometimes referred to as 10-space or 11-point dividers. Check the Ebay sites in Britain and Canada. I’ve seen them show up there as well.

With these dividers you can very quickly divide a space into as many as 10 units. I used to use them mainly for laying out stairs or room paneling but now they are irreplaceable for scaling off a photograph or drawing while simultaneously drafting on the computer. Trying to scale the material from the computer screen while doing this would be much slower. For the times I do have an image in digital form and need to scale from the screen, I’ll flip a piece of acetate over the monitor to keep the sharp teeth from scratching the screen. It’s fun to watch people with expensive monitors see me do this and gasp in horror.